This is our second post in the Website Analytics series which is designed as an introduction to using web anayltics. You can read the first post “The importance of measurement” by clicking the preceding link.
There are a lot of website measurement tools out there. Finding the right fit for your website’s goals is important. Each of the packages below are tools to help you find out what is going on with your website. Using the wrong tool for the job will just lead to frustration. Some of the tools below are designed to work with a wide range of sites, while others have specific niches where they excel.
In the end, the best tool for the job is the one that you’re able to use effectively. If you like the layout, look and feel, report generation, etc., of a specific solution, and it provides you with relevant and actionable metrics, then it’s the right tool for the job.
Google Analytics — Free
The 800 pound gorilla of the web measurement space. Google Analytics has a very broad reach, designed to give actionable metrics to just about everyone. Installing it is a snap. Simply insert a small javascript snippet on the page(s) you want to measure, and you’re done. It’s widely used, and therefore has very broad support. You can find lots of help with this product on numerous blogs or from consultants. It collects a lot of data points and can give you an enormous amount of information about how visitors interact with your website.

On the flip-side, it gives you enormous amounts of information, so much so that it can easily overwhelm people, or get them focused on the wrong metric. It’s also yet another web property controlled by Google, which can be a pro for some and a con for others, depending on your privacy point of view. While GA does have goal tracking and “event” tracking, it’s not as robust as more specialized solutions.
Pros:
- Easy to install
- Wide support
- Free
- Lots of data
Cons:
- Information Overload
- Event tracking isn’t as strong as it could be
- Another Google Web property
Clicky — Free to $50+/mo.
Click has been around for a long time, and it shows a bit in their interface. The pages and reports lack the polish of some of the other platforms. Visual appearance and navigation systems aside, the service does provide a lot of very good information. The amount of data coming at you can feel a bit overwhelming (much like Google Analytics) but the dashboards do have most of the important information available in a click or two.
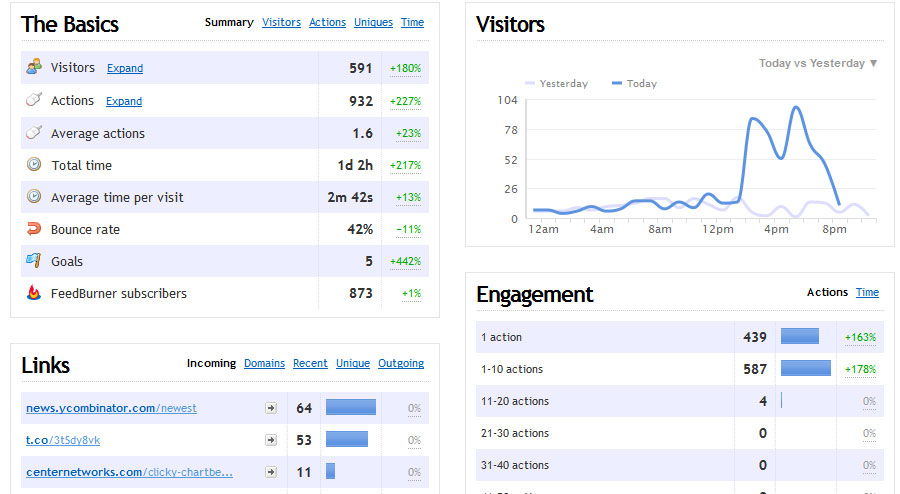
One of Clicky’s “big” differences is in how bounce rate is calculated. Most other analytics packages track based on the next page event. Measuring bounce rate in this way can be a bit misleading especially for content providers. With Clicky, if a visitor lands on a page on your site and does not leave the site within thirty seconds, the traffic is not considered a bounce.
The bigger the package you get with Clicky, the more features you get, but the base (free up to 3000 page views per day) will get you the basics.
Pros:
- Free — Low cost
- Twitter integration
- Better bounce rate
Cons:
- Navigation systems and reports lack polish
- Information overload
Piwik— Free
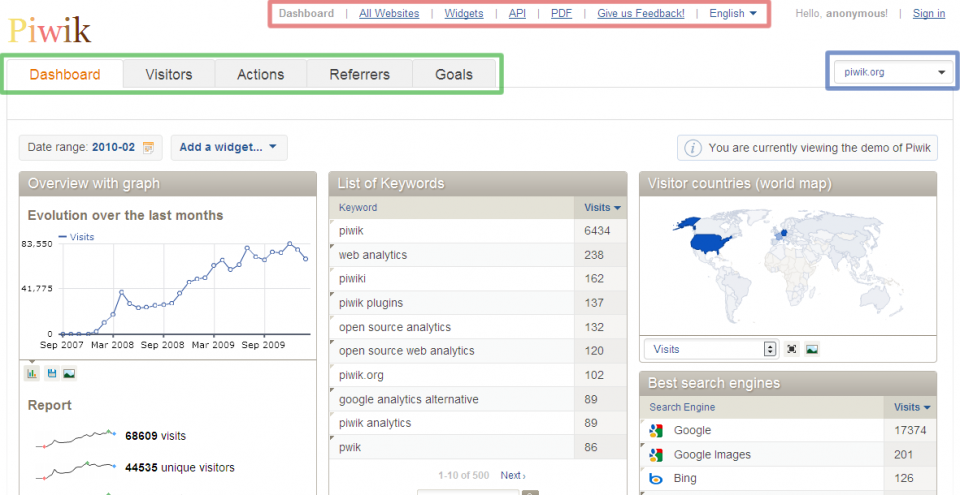
Piwik is an open source analytics software. It is also the only one on our list that is self hosted. Piwik was introduced in 2007 as a replacement for PhpMyVisites. It offers the standard line offering out of the box. Piwik was created with expandability in mind and has a reasonable library of plugins that extend the base product. Development of Piwik remains active with version 2.0 on the horizon.
Since the product is self hosted there is no cost for the product itself. Being self hosted can be a benefit and a curse. It’s a bit more difficult to set up than your hosted methods. You’ll need to get a little bit dirty in your hosting control panel and transfer some files to your web host. There are some good tutorials on how to do this.
A big benefit here is you completely own the data, and you can, in theory, keep it forever if you have enough available space. You don’t have to worry about someone deleting or turning off access to your analytics data. On the other hand, being self hosted results in a little bit more overhead on your server. For most sites this isn’t an issue, but as your site scales up with traffic you might want to consider server load and perhaps move the package to its own host.
Pros:
- Open Source
- No Cost
- Active plugin development
Cons:
- Installation is a bit more difficult
- Self hosted can create performance issues.
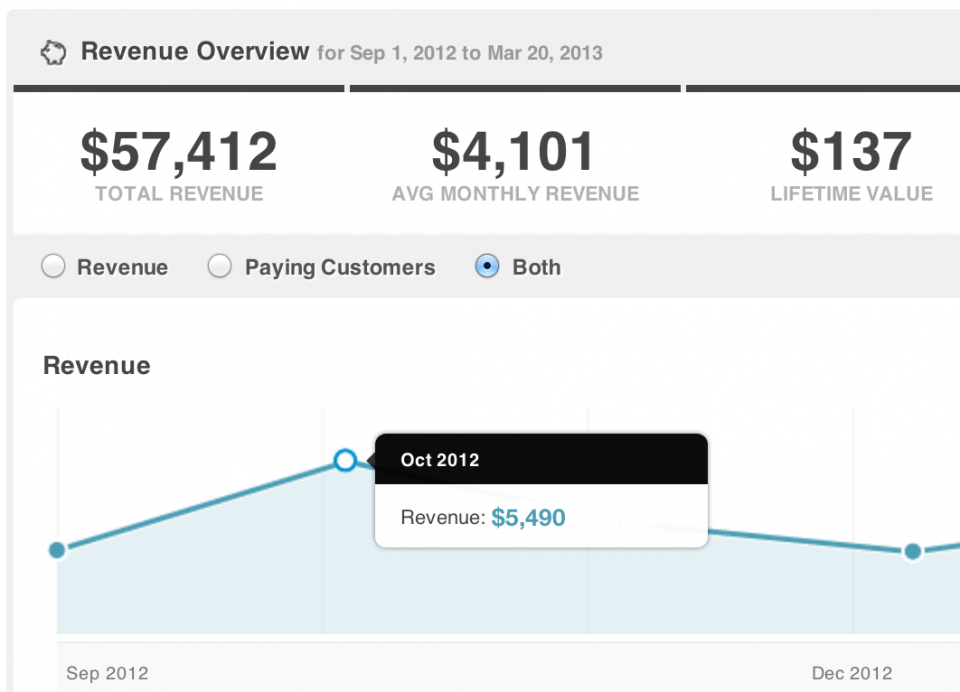
Gaug.es — $6/mo — $48+/mo
Gauges is a newer player in the analytics space, but it’s got the weight of GitHub behind it, so longevity issues shouldn’t be a concern here.
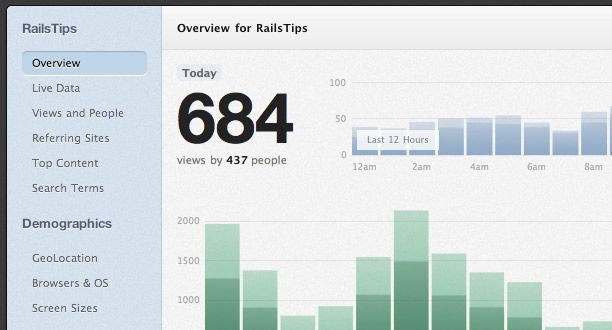
Gauges is dedicated to getting the basics done right. The interface is very well done, with information streamlined and handsomely presented. Information is clear and concise, and you’ll never be in danger of drowning in data.
If you’re looking for goal analysis, funnel tracking, etc., this is not the platform for you. In fact, if you sell anything on your site, you’re not likely to find much value in Gaug.es. If you’re looking for simple, easy-to-understand reports and your core metric is site visitors, then this is a great alternative for you.
Front end developers will especially love some of the report features. Want to know what percentage of your site’s visitors support flex-box? Two clicks and you’re there.
Pros:
- Simple/Polished interface
- No data overload
- REST API and top-notch developer features
Cons:
- No Goal/Event tracking
- Not enough data
Real Time Analytics
I’ve separated out a couple of “Real Time Analytics” packages here, although all of the analytics packages listed thus far have real time information. The packages listed in this section are more focused on this niche. If you’re a content publisher that lives on the news jacking cycle, these packages may be of more interest to you.
Woopera FREE — $499+/mo
Woopera has been around for a long time. If you’ve seen some earlier views of this package, I’d advise you to give it a second look. The UI is polished clean and easy to navigate. Features abound in the package from run-of-the-mill analytics to its real time integrations.
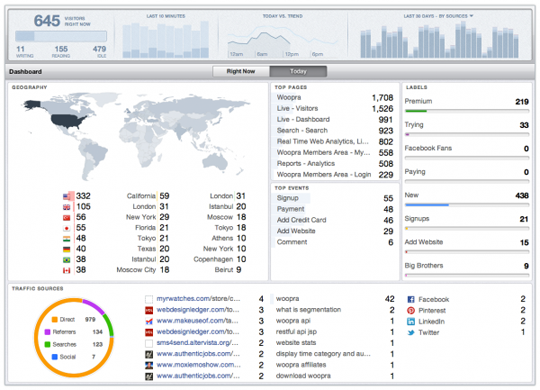
One of Woopera’s neat features is direct engagement with visitors. Once identified, the user retains a name (e.g. “visitor 1” will remain “visitor 1” on subsequent visits). You can rename these visitors to personalize each engagement. Woopera also allows you to open a chat window directly with a site visitor.
Site funnels are supported and user metrics are oriented more toward action items than toward page views making Woopera a strong contender in the action/event space
Pros:
- Clean easy to use interface
- Real time customer interaction
- Funnel Support
Cons:
- Price (though it’s consistent for the niche)
- Reports are a bit underwhelming
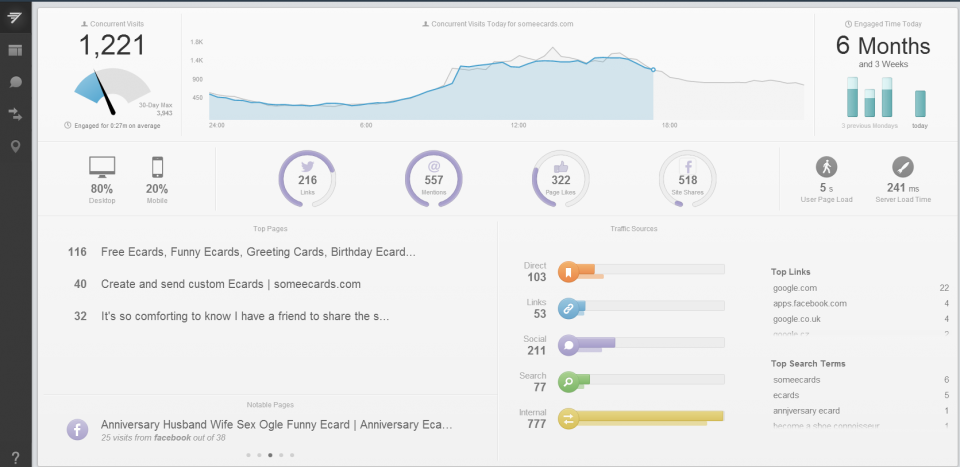
Chartbeat — $10/mo — N/A
Chartbeat is all about the here and now, and it does this beautifully. Chartbeat was designed for content publishers. All of its measurement metrics are based on what is happening on your site in real time. See social engagement, shares/likes as well as which articles are currently hot on your site. It does this in a very easy-to-read, big dashboard way. For a simpler website, I don’t see this platform providing much value. However, if you’re heavy into content with multiple posts per day and want a platform to help you react to the now, Chartbeat may be what you’re looking for.
At the time of this writing Charbeat is working on a product for people who sell items through their website, but it’s not currently available. If you sell items on your website, the current Chartbeat platform isn’t going to provide you with much value.
Pros:
- Beautiful clean user interface
- Social integration
Cons:
- Lack of historical reporting
- No funnel concepts
- Not for eCommerce sites
Event Driven Analytics
Much like the real time analytics category, some (but not all) of the aforementioned packages offer event driven analytics. The packages listed here focus specifically on this space and do it very well. If you sell products online or offer software as a service, you would do well to take a look at one of these packages.
Mixpanel — Free – $2,000+/mo.
Mixpanel excels at giving you tools to slice and dice your customer events into meaningful data for your site or app. If, for instance, you wanted to understand which Google AdWord campaign is currently yielding the highest number of converted sales, it’s very easy to segment the data that way. Full funnel tracking, customer engagement, and retention are also available.
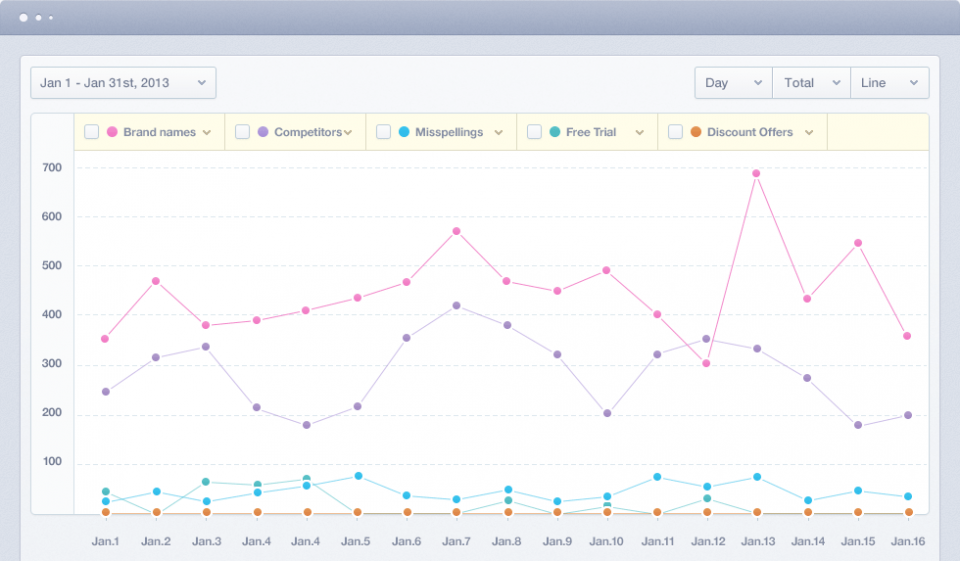
Mixpanel tracks events that you configure. This differs a bit from standard analytics packages that track all page views on a site. With events you can measure what you’re really interested in, such as a step in the sales funnel, a video download, a song play, or a contact form submission. Mix panel is also not limited to a website. Event tracking can also be done in iOS or Android apps, or other web apps.
Mixpanel also supports people plans which can be used to track behavior of specific users or groups of like users. In the same way you would slice and dice an AdWords stat, you could easily find out the lifetime revenue of a specific customer, or customer class.
Setup is going to be a bit more in depth than a typical analytics package. You can’t just add a javascript snippet to a site footer and forget it. You do need to tell Mixpanel when to track an event. Their documentation is good, and this isn’t overly difficult, but it is more in depth than a typical package.
Mixpanel has a lot to offer. It can get expensive if you’re a very high volume site and are tracking hundreds of events, but there is overwhelming value in the data provided.
Pros:
- Easy to use interface
- Very specific and actionable event metrics
- App integration
Cons:
- Setup is slightly more difficult
Kissmetrics –$150/mo — $500+/mo
Kissmetrics is the “more mature” player in the space, having been around a little longer than Mixpanel. Where Mixpanel focuses a little bit more on the event space, Kiss focuses a bit more on the people space. Where “people” seems to be an afterthought with Mixpanel, it’s front and center in the Kissmetrics platform.
The interface in Kissmetrics feels a bit clunky as compared to the Mixpanel interface, which is clean and modern.
Pros:
- Very specific and actionable event metric
- Focus on customer
- App integration
Cons:
- Setup is slightly more difficult
- Interface needs a bit more work.
Both Kissmetrics and Mixpanel are excellent platforms if you’re a SasS (software as a service) provider or eCommerce site. Both will provide you with great data. These platforms are under constant development and are rapidly adding features, so check out both offerings before you make a decision and see which works best for your situation.
Final Thoughts…
I should note here that we are not affiliated in any way with any of the providers on this list. The opinions expressed about each platform are based on our experience with using each of them. This list is also not exhaustive. There are plenty of other solutions out there as well, some free and some that are cost prohibitive to all but the largest of enterprises. As we stated at the start, the real tool for the job is the one that you are able to use most effectively.
Stay tuned for the next article in our series when we discuss analytic terms and what they mean to your business.
Have something to add to the conversation? Feel free to comment below.